13 Digital Marketing Metrics to Track for Success in 2026

Measuring success in digital marketing isn’t about vanity metrics or gut feelings. It’s about tracking the right data points that actually move your business forward. At PWD, we’ve seen countless campaigns succeed or fail based on how well businesses understand and act on their performance data.
The challenge isn’t finding metrics to track – it’s choosing the ones that matter for your specific goals. Whether you’re driving leads for a service business or selling products online, the wrong metrics will waste your time and budget on activities that don’t deliver results.
Here’s your guide to the 13 most important digital marketing metrics that actually predict success, plus what you should ignore to stay focused on what counts.
What Digital Marketing Metrics Actually Tell You
Digital marketing metrics are performance indicators that show how well your campaigns connect with your audience and drive business results. Think of them as your campaign’s vital signs – they tell you what’s healthy, what needs attention, and what’s about to flatline.
Without proper measurement, you’re flying blind. You might think your Facebook ads are performing brilliantly because they’re getting lots of engagement, but if they’re not driving qualified leads or sales, you’re burning money on feel-good metrics that don’t pay the bills.
The right metrics help you make data-driven decisions about where to invest your marketing budget. They reveal which channels bring your best customers, which campaigns need optimisation, and which tactics you should abandon entirely.
Your metrics should follow the SMART framework: specific, measurable, achievable, relevant, and time-bound. A vague goal like “increase brand awareness” becomes actionable when you define it as “increase organic website traffic by 25% within three months.”
The 13 Digital Marketing Metrics That Drive Results
These metrics form the foundation of successful digital marketing measurement. Each one tells part of your performance story, but together they give you the complete picture of what’s working and what isn’t.
1. Overall Website Traffic
Your total website traffic shows the volume of people engaging with your content. More importantly, traffic trends reveal whether your marketing efforts are expanding or contracting your reach over time.
Look beyond the raw numbers. A 20% increase in traffic means nothing if it’s coming from irrelevant sources. Focus on qualified traffic that matches your target audience demographics and behaviour patterns.
2. Total Conversions
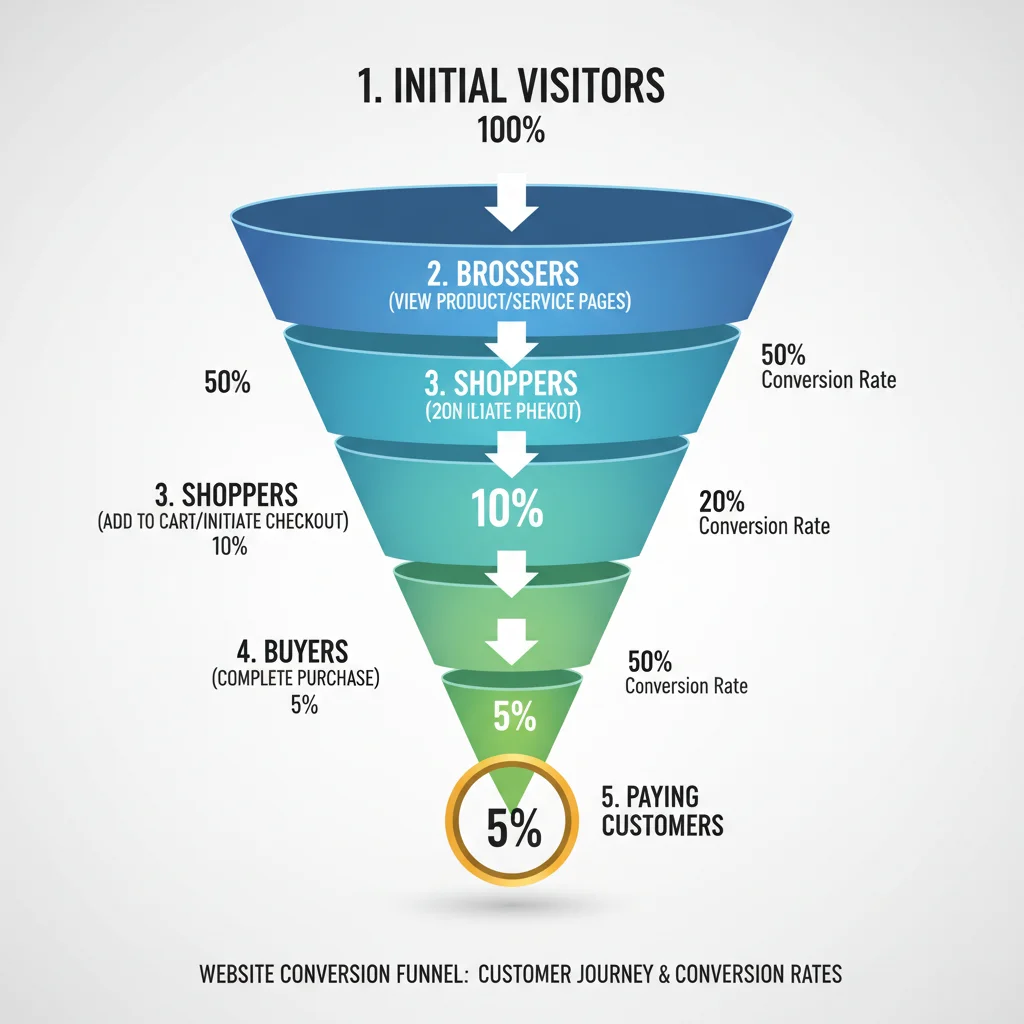
Conversions are completed desired actions – purchases, form submissions, phone calls, or email signups. This metric directly connects your marketing activity to business outcomes.
If conversions are falling short, examine your conversion path. Is your call-to-action clear? Does your landing page match your ad message? Are you asking for too much information upfront? Small changes here often deliver massive improvements.
3. Channel-Specific Traffic
Understanding which channels drive your traffic helps you allocate resources effectively. Your channels might include organic search, paid advertising, social media, email marketing, and direct visits.
Don’t just focus on the highest-volume channels. Sometimes a smaller channel delivers higher-quality visitors who convert at better rates. Quality beats quantity when you’re paying the bills.
4. Bounce Rate
Bounce rate measures the percentage of visitors who leave your site after viewing only one page. High bounce rates often signal mismatched expectations, slow loading times, or irrelevant content.
However, context matters. A blog post that fully answers someone’s question might have a high bounce rate but still serve its purpose. Compare bounce rates across similar page types rather than using blanket benchmarks.
5. Brand Sentiment
Brand sentiment tracks what people say about your business online. While not a traditional metric, it predicts future performance and helps you spot reputation issues before they escalate.
Set up Google Alerts for your brand name and monitor social media mentions. Positive sentiment often correlates with improved SEO performance and higher conversion rates as trust builds with your audience.
6. Exit Rate
Exit rate shows the percentage of visitors who leave your site from a specific page. Unlike bounce rate, these visitors may have viewed multiple pages before leaving.
High exit rates on key conversion pages indicate problems with your user experience or offer. Use this data alongside user experience optimisation to identify and fix conversion bottlenecks.
7. Engagement Rate
Engagement rate varies by platform but generally measures how actively your audience interacts with your content. On social media, this includes likes, shares, and comments. On your website, consider time on page, pages per session, and scroll depth.
High engagement rates indicate relevant, valuable content that resonates with your audience. Low engagement suggests you need to better understand your audience’s interests and pain points.

8. Email Open Rate
Email open rate measures how many recipients open your email campaigns. This metric reflects the effectiveness of your subject lines, sender reputation, and audience segmentation.
Benchmark open rates vary by industry, but focus on your own trends rather than generic standards. Test different subject lines, send times, and segmentation strategies to improve performance.
9. Click-Through Rate (CTR)
CTR measures how often people click on your ads, emails, or other promotional content. Higher CTRs indicate compelling offers and relevant targeting.
In paid advertising, CTR directly affects your ad costs. Platforms like Google reward high-CTR ads with lower costs and better placement, making this metric both a performance indicator and a cost-control factor.
10. Cost Per Click (CPC)
CPC shows how much you pay for each click on your paid advertisements. Lower CPCs stretch your advertising budget further, allowing more traffic for the same investment.
Reduce CPC by improving your Quality Score through better ad relevance, landing page experience, and expected CTR. Well-crafted ad copy that matches search intent typically achieves lower costs.
11. Cost Per Lead (CPL)
CPL calculates how much you spend to generate each qualified lead. This metric helps you evaluate which campaigns and channels deliver leads most efficiently.
Compare CPL across different traffic sources to identify your most cost-effective lead generation methods. Remember that cheaper leads aren’t always better if they convert to customers at lower rates.
12. Customer Acquisition Cost (CAC)
CAC includes all costs associated with acquiring a new customer – advertising spend, sales team costs, marketing tools, and any other acquisition expenses.
Your CAC must be significantly lower than your customer lifetime value for profitable growth. If you’re spending $500 to acquire customers worth $400, you’ll go broke fast regardless of how many customers you gain.
13. Return on Investment (ROI)
ROI measures the profit generated by your marketing investment. Calculate it by subtracting marketing costs from revenue generated, then dividing by marketing costs.
Track ROI for individual campaigns, channels, and your overall marketing program. This metric helps you make budget allocation decisions and proves marketing’s contribution to business growth.
Metrics You Should Ignore
Not all metrics deserve your attention. Vanity metrics look impressive but don’t connect to business outcomes. Here’s what to avoid tracking unless they directly support specific campaign goals:
- Social media followers (unless building audience is your specific goal)
- Page views without conversion context
- Email list size without engagement rates
- Brand impressions without recall or action
- Website rankings without traffic or conversion data
Ask yourself: “If this metric improves, will my revenue grow?” If the answer isn’t a clear yes, spend your time on metrics that matter more.
Focus beats breadth every time. It’s better to deeply understand five relevant metrics than to superficially track 20 that don’t drive decisions.
Building Your Measurement Strategy
Start by defining your business objectives, then work backwards to identify the metrics that predict success. A lead generation business needs different measurements than an e-commerce store.
Set up proper tracking before launching campaigns. Install Google Analytics, configure conversion tracking, and establish baseline performance levels. You can’t improve what you don’t measure accurately.
Review your metrics regularly but don’t obsess over daily fluctuations. Weekly reviews help you spot trends without getting distracted by normal variation. Monthly deeper dives identify optimisation opportunities and strategic adjustments needed.

Remember that metrics are tools for decision-making, not scorecards for bragging rights. The best metric is the one that helps you make your next campaign more profitable than your last one.
Want help setting up measurement systems that actually drive growth? Contact PWD to discuss your digital marketing strategy and tracking needs. We’ve helped hundreds of Australian businesses build measurement frameworks that turn data into profitable action.
Frequently Asked Questions
Which digital marketing metrics matter most for small businesses?
Focus on conversion rate, cost per acquisition, and return on investment. These directly connect your marketing spend to revenue. Track overall website traffic and lead generation costs as secondary metrics.
How often should I check my marketing metrics?
Review key metrics weekly to spot trends and monthly for strategic decisions. Daily monitoring can lead to overreacting to normal fluctuations. Set up automated alerts for significant changes.
What’s a good conversion rate for digital marketing?
Conversion rates vary dramatically by industry and campaign type. E-commerce sites average 2-3%, while B2B lead generation might see 1-5%. Focus on improving your own baseline rather than industry benchmarks.
Should I track social media followers and likes?
Only if building brand awareness is a specific business objective. For most businesses, engagement rates and traffic from social platforms matter more than follower counts. Focus on metrics that drive revenue.
How do I calculate return on investment for digital marketing?
Subtract total marketing costs from revenue generated by marketing, then divide by marketing costs. For example: ($10,000 revenue – $2,000 costs) ÷ $2,000 = 400% ROI. Track this monthly for accuracy.