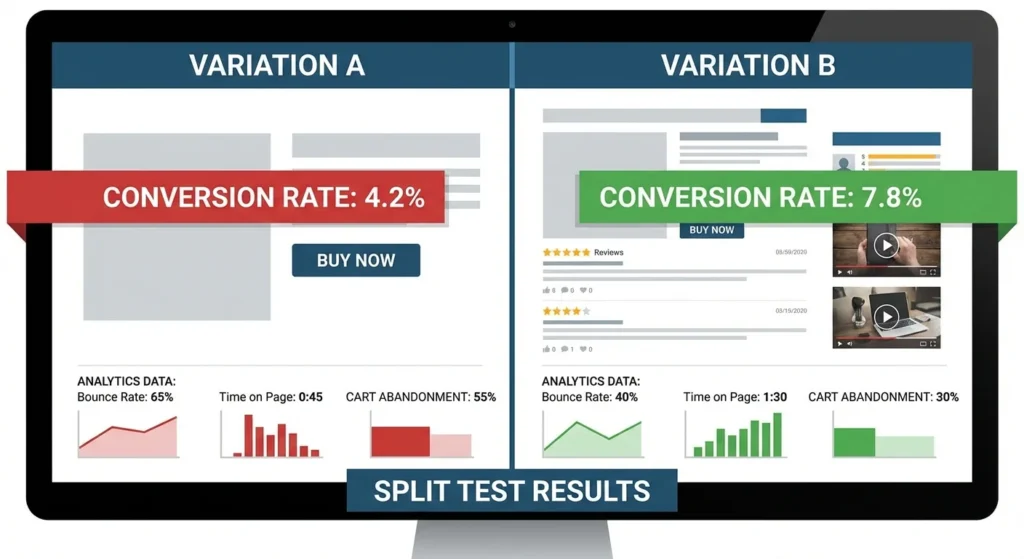
How to Use A/B Testing to Increase Website Conversions in 2026

Website visitors make split-second decisions about your business. In those critical first 10 seconds, you’re either winning them over or watching them click the back button. The difference often comes down to one thing: conversion rate optimisation.
Every element on your page – from headlines to button colours – impacts whether visitors take action or bounce. But how do you know which changes actually improve results? This is where A/B testing becomes your secret weapon for data-driven growth.
Google Content Experiments offers a free, powerful solution for testing website variations and measuring real conversion impact. Here’s how to harness this tool to turn more visitors into customers.
Why A/B Testing Transforms Website Performance
A/B split testing compares two versions of a webpage to determine which drives better results. You split traffic equally between the original and a variation, then measure which version achieves more conversions.
The statistics tell a compelling story. Forrester Research found that every dollar invested in user experience generates $100 in return – a staggering 9,900% ROI. Yet businesses spend $92 on customer acquisition for every $1 spent on conversion optimisation. That’s leaving serious money on the table.
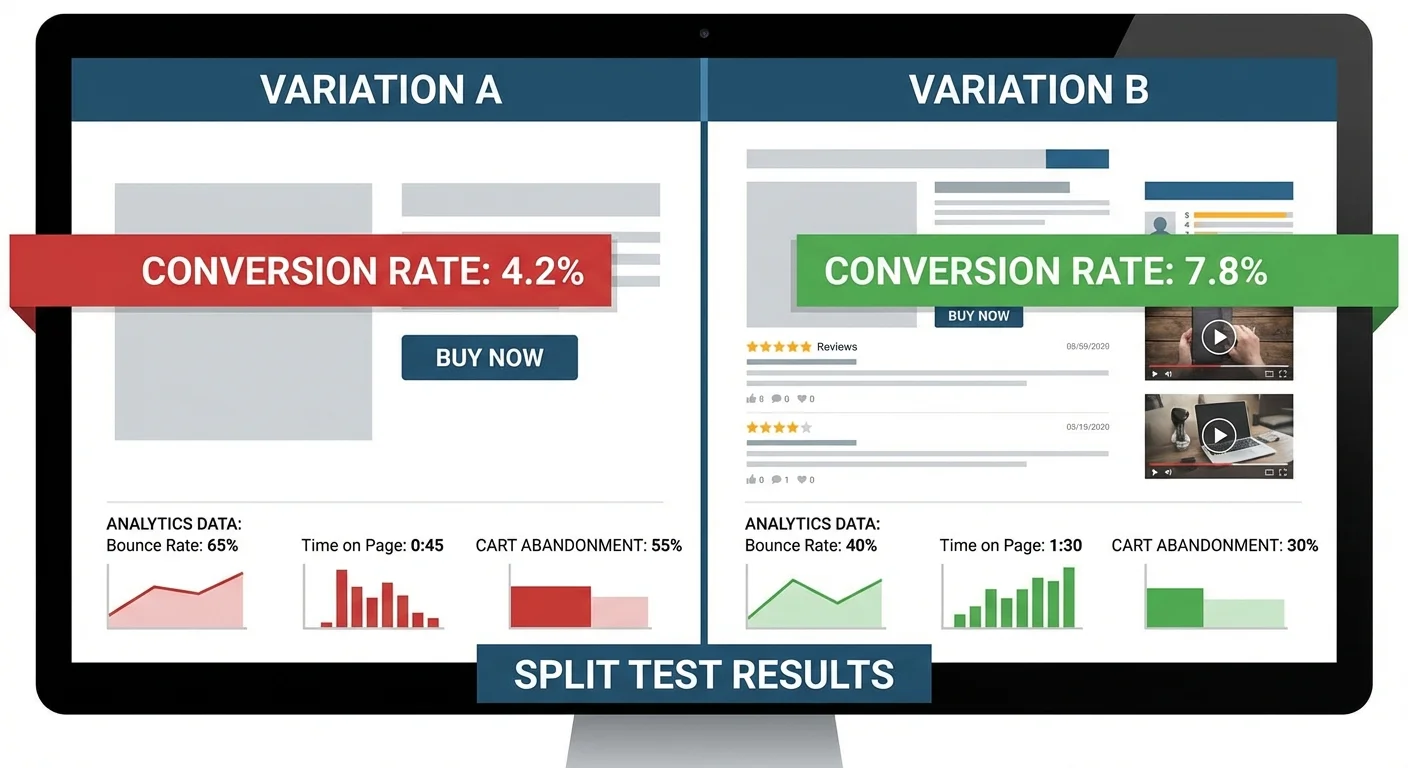
A/B testing reveals which design elements actually drive conversions
What works for one website might fail spectacularly for another. User experience optimisation isn’t about following best practices blindly – it’s about testing what resonates with your specific audience.
Setting Up Google Content Experiments
Google Content Experiments lives inside Google Analytics 4, making it accessible to anyone with an Analytics account. The tool integrates seamlessly with your existing tracking setup and delivers results alongside your other website metrics.
Creating Your First Experiment
Log into Google Analytics and navigate to “Experiments” under the Behaviour section. Click “Create experiment” to start building your test.
Name your experiment specifically – avoid generic labels like “Homepage Test”. Use descriptive names like “Hero Section CTA Button Test” or “Pricing Page Headline Variation”. When you’re running multiple tests, specific names save time and confusion.
Defining Your Objectives
Objectives measure the specific actions you want visitors to take. These might include newsletter signups, purchase completions, or form submissions. Clear objectives ensure you’re measuring meaningful business outcomes, not vanity metrics.
For destination-based goals, enter the URL users reach after converting – typically a thank-you or confirmation page. This gives Analytics a clear signal when conversions occur.
The traffic percentage setting controls how many visitors see your variations. Start with 100% for faster results unless you’re testing potentially risky changes that could harm user experience.
Configuring Page Variations
Enter your original page URL, then add the variation page URL. You can test multiple variations simultaneously, but start with one or two to maintain statistical validity.
Focus on testing single elements per experiment. Testing headlines, button colours, and layouts simultaneously makes it impossible to identify which change drove results. Isolate variables for clearer insights.
Installing the Tracking Code
Google provides experiment code that must be added to your website’s header. For WordPress sites, install the “Google Content Experiments” plugin for easier code management.
The plugin adds experiment settings to individual pages and posts, streamlining the setup process. Once configured, Analytics validates your code and confirms the experiment is ready to launch.
High-Impact Elements to Test
Not all page elements have equal conversion impact. Focus your testing efforts on components that directly influence user decisions and actions. Here are the elements that typically deliver the biggest performance improvements.
Headlines That Convert
Headlines are often the first thing visitors read. They need to communicate value quickly and compellingly. Even minor headline changes can generate massive conversion lifts – one test showed a 38% increase in signups from a simple headline revision.
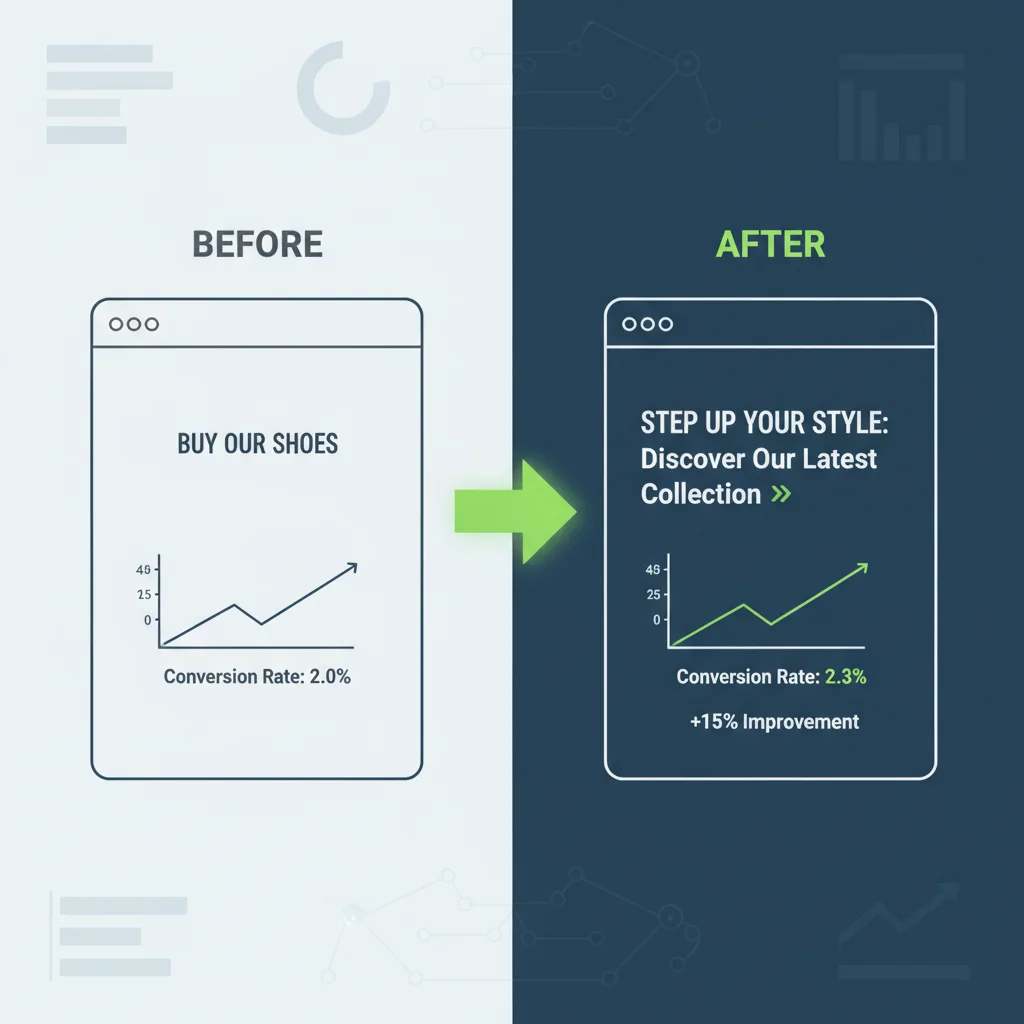
Small headline changes can drive significant conversion improvements
Test these headline approaches:
- Benefit-focused copy (“Accounting Software That Automates Your Billing”)
- Social proof integration (“Join 50,000+ Businesses Using Our Platform”)
- Direct value propositions (“Create Professional Websites in Minutes”)
- Urgency creation (“Limited-Time Offer – Act Before It’s Gone”)
Your audience will respond differently to each approach. Testing reveals which messaging style resonates most with your visitors and drives action.
Call-to-Action Button Optimisation
Call-to-action buttons are conversion gateways. Small changes in button copy, colour, or placement can dramatically impact click-through rates. One test showed “Watch Demo” outperforming “See Product Video” by 48%-same concept, different wording.
Test these button variables:
- Colour contrast and visibility
- Action-oriented vs. benefit-focused copy
- Button size and placement
- Single vs. multiple CTA options
Button testing often produces quick wins. Since buttons are conversion bottlenecks, improvements here multiply across your entire visitor base.
Layout and Visual Hierarchy
Page layout guides visitor attention and creates logical flow toward conversion points. Poor layout confuses users and increases bounce rates, while effective layout improvements can generate massive conversion gains – one layout test produced a 304% increase in conversions.
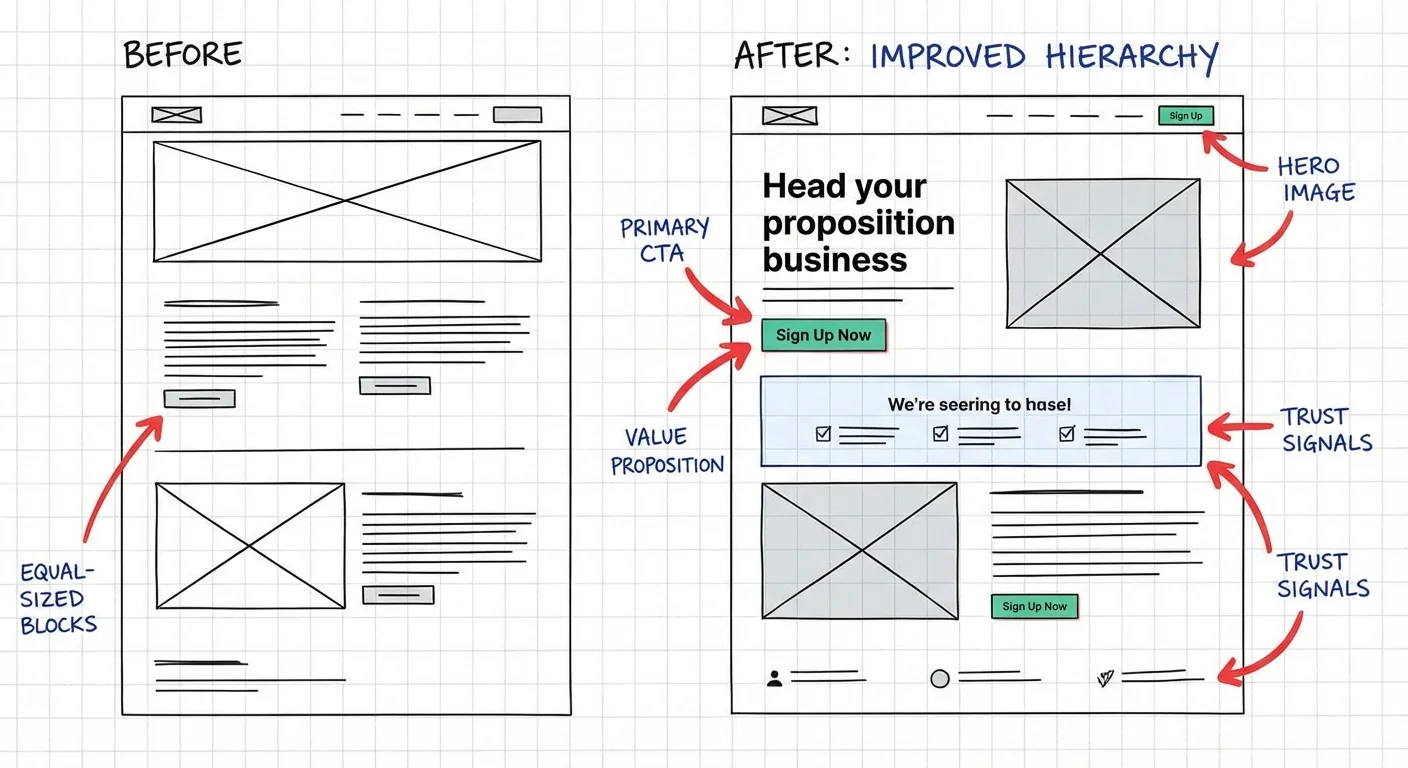
Strategic layout changes guide visitors toward conversion actions
Layout elements worth testing include:
- Form placement and design
- Content organisation and flow
- White space usage
- Colour schemes and contrast
- Typography choices
Web usability principles provide testing direction, but your specific audience preferences matter more than general guidelines.
For more detail, see our guide on usability testing tools.
Social Proof Integration
Social proof reduces purchase anxiety and builds credibility. When prospects see others using and endorsing your product, conversion resistance decreases. The key is testing different social proof types and placements to maximise impact.
Effective social proof formats include:
- Customer testimonials and success stories
- Usage statistics and user counts
- Review ratings and scores
- Industry endorsements and certifications
- Media mentions and press coverage
Test social proof placement near conversion points. Positioning testimonials next to signup forms or pricing information often produces the strongest results.
Interpreting Test Results
Statistical significance determines whether test results reflect real performance differences or random variation. Understanding what GA4 tracks helps you set up more meaningful experiments aligned with your analytics goals. Google Content Experiments calculates significance automatically, but understanding the basics helps you make better decisions.
Run tests until you achieve at least 95% confidence levels with adequate sample sizes. Stopping tests too early leads to false conclusions and poor optimisation decisions.

Monitor test results for statistical significance before making decisions
Consider practical significance alongside statistical significance. A 2% conversion improvement might be statistically valid but economically meaningless for your business goals.
Advanced Testing Strategies
Once you’ve mastered basic A/B testing, advanced strategies unlock deeper optimisation opportunities. These approaches require more sophisticated planning but often reveal insights that simple tests miss.
Sequential Testing Programs
Build testing roadmaps that progressively refine page performance. Start with high-impact elements like headlines and CTAs, then test supporting elements based on initial results. This systematic approach compounds improvements over time.
Document test results and insights to inform future experiments. Winning variations become new baselines for additional testing rounds.
Segment-Specific Optimisation
Different visitor segments respond to different messaging and design approaches. Test variations targeted to specific audience segments for more personalised experiences.
Segment by:
- Traffic source (organic, paid, social, direct)
- Geographic location
- Device type (desktop, mobile, tablet)
- New vs. returning visitors
- Industry or company size (for B2B sites)
Digital marketing campaigns often benefit from segment-specific landing pages optimised for different audience needs.
Common Testing Pitfalls to Avoid
Testing mistakes waste time and resources while producing misleading results. Avoid these common errors to ensure your optimisation efforts generate real business value.
Testing Too Many Variables
Testing multiple elements simultaneously makes it impossible to identify which changes drove results. Focus on single variables per test to maintain clear cause-and-effect relationships.
Stopping Tests Prematurely
Early results often fluctuate dramatically before stabilising. Wait for statistical significance and adequate sample sizes before declaring winners.
Ignoring Mobile Performance
Mobile users behave differently than desktop users. Test variations across device types to ensure optimisations work for your entire audience.
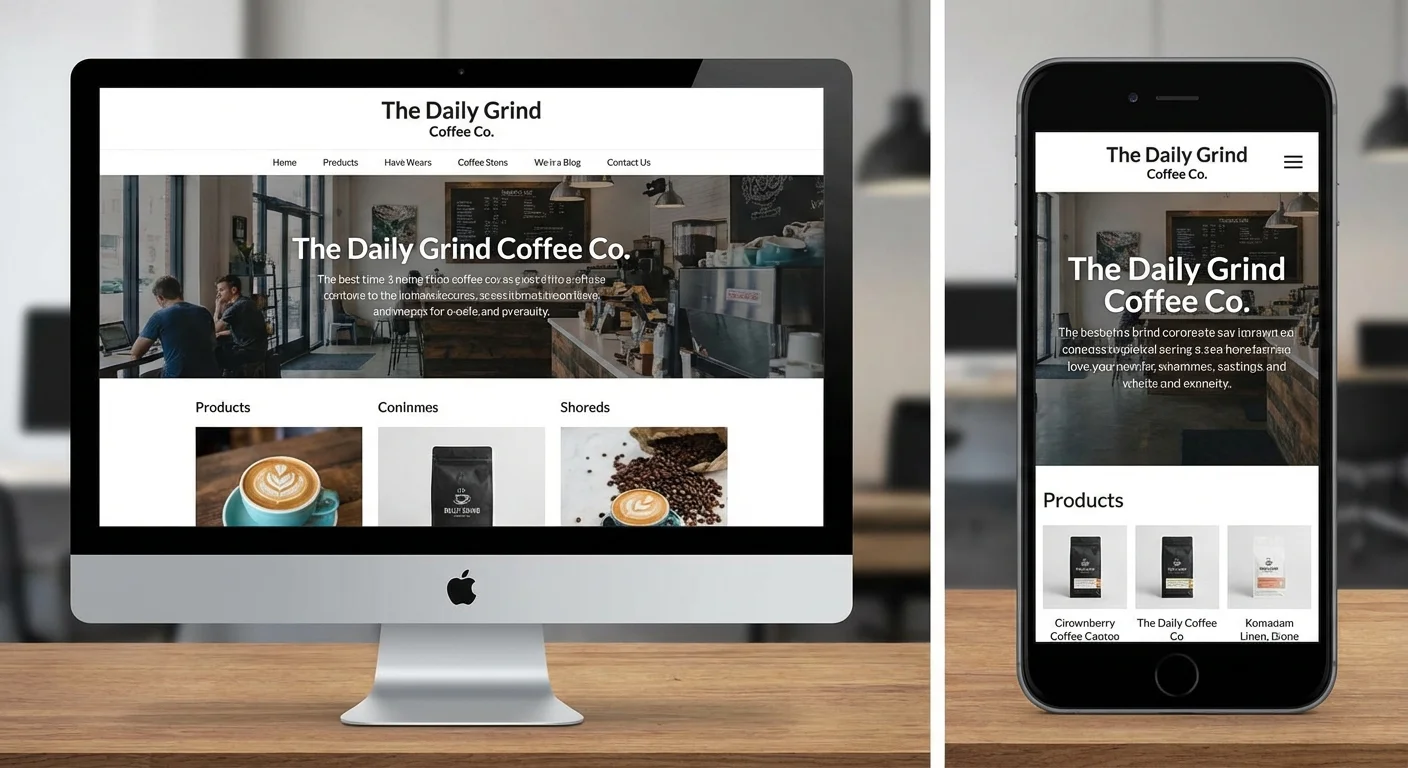
Test variations across all device types for complete optimisation
Scaling Your Testing Program
Successful A/B testing becomes an ongoing optimisation system rather than one-off experiments. Scale your program systematically to maximise long-term conversion improvements.
Start with high-traffic pages that generate the most conversions. These pages provide faster test completion and bigger impact from improvements. Track SEO metrics alongside conversion metrics to understand how changes affect organic visibility.
Expand testing to supporting pages once primary conversion pages are optimised. Product pages, blog posts, and category pages all influence the conversion path and deserve testing attention.
Consider upgrading to dedicated testing tools as your program matures. While Google Content Experiments provides excellent starting capabilities, tools like Optimizely or VWO offer advanced features for complex testing scenarios.
Measuring Long-Term Impact
Track the cumulative effect of testing improvements over time. Individual tests might show modest gains, but multiple optimisations compound into significant performance improvements. This compounding effect is especially powerful when combined with broader small business marketing strategies.
Monitor these key metrics:
- Overall conversion rate trends
- Revenue per visitor
- Customer acquisition costs
- Lifetime value improvements
Regular testing often reveals insights that inform broader digital marketing strategy decisions. Winning headlines might inspire ad copy improvements, while successful social proof formats could enhance email campaigns.
A/B testing transforms websites from static marketing assets into dynamic conversion engines. Start with Google Content Experiments to build testing fundamentals, then expand your optimisation efforts as you see results. Every test brings you closer to understanding what motivates your audience to act – and that knowledge becomes a sustainable competitive advantage.
Frequently Asked Questions
How long should I run A/B tests?
Run tests until you achieve 95% statistical significance with at least 100 conversions per variation. This typically takes 1-4 weeks depending on your traffic volume.
Can I test multiple elements simultaneously?
Test one element at a time for clearer results. Testing multiple changes simultaneously makes it impossible to identify which change drove performance improvements.
What’s the minimum traffic needed for A/B testing?
You need at least 1,000 monthly visitors and 100+ conversions per month for meaningful test results. Lower traffic requires longer test periods or simpler success metrics.
Should I test on mobile and desktop separately?
Yes, mobile and desktop users behave differently. Run tests across all device types or create device-specific variations for better optimisation results.
How do I know if my test results are reliable?
Look for 95% statistical confidence with adequate sample sizes. Avoid stopping tests early based on initial results as they often fluctuate significantly.
What should I test first on my website?
Start with headlines and call-to-action buttons on your highest-traffic conversion pages. These elements typically produce the biggest impact with relatively simple changes.